- Double Top एक bearish reversal chart pattern है, जो आमतौर पर uptrend के अंत में बनता है। इसमें price दो बार लगभग एक ही resistance level तक जाता है और फिर नीचे की ओर टूटता है. यह संकेत देता है कि अब बाजार में कमजोरी आ सकती है. ( Double Top is a bearish reversal chart pattern that usually forms at the end of an uptrend. The price reaches nearly the same resistance level twice and then breaks downward, indicating possible market weakness. )
- डबल टॉप पैटर्न क्या है ? (What is Double Top Pattern?)
- Double Top Pattern एक bearish reversal chart pattern होता है, जो यह दिखाता है कि अब uptrend खत्म हो सकता है और price नीचे जा सकता है. (Double Top Pattern is a bearish reversal chart pattern, Which shows that now the uptrend may end and the price may go down.)
- Double Top Pattern usually तब बनता है जब market दो बार एक ही resistance level को touch करता है.लेकिन उसे तोड़ नहीं पाता.(Double Top Pattern usually forms when the market touches the same resistance level twice. But cannot break it.)
- पैटर्न की बनावट (Pattern Structure)
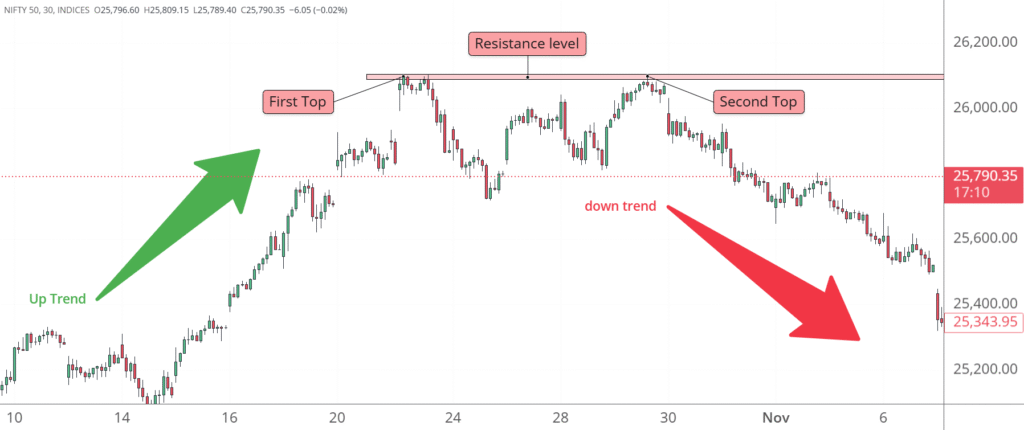
- First Top – Price ऊपर जाता है और resistance से वापस आता है (First Top – Price goes up and comes back from resistance )
- Pullback – Price थोड़ा नीचे आता है (Pullback – Price comes down slightly)
- Second Top – Price फिर उसी resistance तक जाता है लेकिन breakout नहीं कर पाता (Second Top – Price again reaches the same resistance but is unable to breakout )
- Neckline Break – Neckline के नीचे price टूटता है confirmation(Neckline Break – price breaks below the neckline confirmation)
- Neckline break होने के बाद sell signal माना जाता है (Sell signal is considered after neckline break.)
- ज़रूरी बातें (Important Points)
- High volume on neckline break = strong confirmation,Higher timeframe (15min, 1H, Daily) ज़्यादा reliable बिना confirmation entry न लें (High volume on neckline break = strong confirmation,Higher timeframe (15min, 1H, Daily) More reliable Do not take entry without confirmation)
- Disclaimer
- यह जानकारी केवल शैक्षणिक उद्देश्य (Educational Purpose) के लिए है, यह कोई निवेश सलाह नहीं है. शेयर बाजार जोखिमों के अधीन है — कोई भी ट्रेड अपने financial advisor से सलाह लेकर करें.(This information is for educational purpose only. This is not investment advice. The stock market is subject to risks — consult your financial advisor before making any trades.)
अगर आप Bearish हरामी या Bullish हरामी के बारे में जानकारी जानना चाहते हैं तो नीचे दिए गए बटन पर क्लिक करें(If you want to know information about Bearish Harami or Bullish Harami then click on the button given below)
One Comment