- Double Bottom Pattern एक Bullish Reversal Chart Pattern होता है, जो यह संकेत देता है कि गिरता हुआ बाजार अब ऊपर की ओर जा सकता है.( This pattern usually forms after a downtrend and indicates a possible trend reversal from bearish to bullish.)
- Double Bottom Pattern की पहचान (Structure)
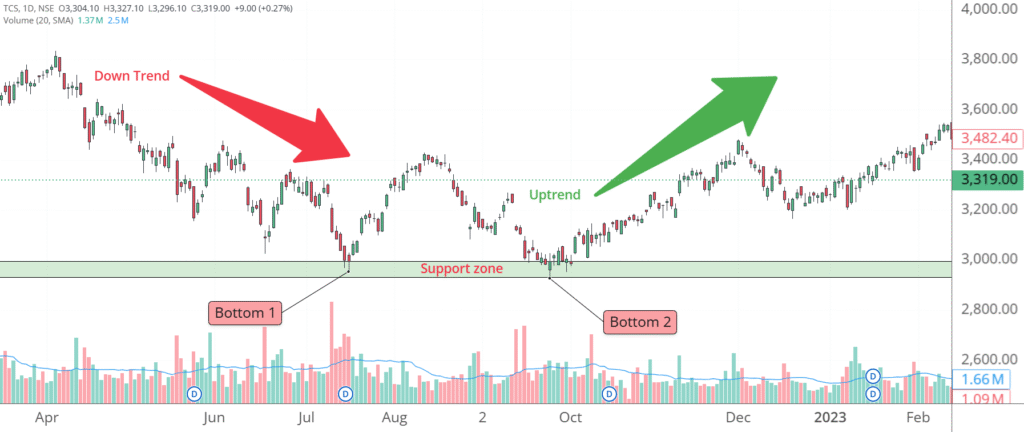
- कीमत पहले नीचे गिरती है और एक Low (Bottom) बनाती है. (Price makes a first low )
- फिर थोड़ी रिकवरी आती है. (Pulls back upward.)
- दोबारा लगभग उसी लेवल पर गिरकर दूसरा Bottom बनता है.(Falls again to form a second low near the first.)
- दोनों बॉटम के बीच जो हाई बनता है, उसे Neckline कहते हैं. (The high between the two lows is called the Neckline.)
- Double Bottom Pattern का ब्रेकआउट (Breakout)
- जब प्राइस Neckline के ऊपर क्लोज़ देता है.और वॉल्यूम बढ़ा हुआ होता है.तब इसे Confirmed Double Bottom Breakout माना जाता है.यह संकेत देता है कि buyers market में आ चुके हैं.(When the price closes above the neckline and the volume is increased, it is considered a confirmed double bottom breakout. This indicates that buyers have entered the market.)
- Disclaimer
- यह कंटेंट केवल शैक्षणिक उद्देश्य (Educational Purpose) के लिए है.यह कोई खरीदने या बेचने की सलाह नहीं है.शेयर बाजार में जोखिम होता है, कृपया अपने वित्तीय सलाहकार से सलाह लेकर ही ट्रेड करें.(This content is for educational purposes only. It is not a recommendation to buy or sell. The stock market involves risk; please consult your financial advisor before trading.)
डबल टॉप चार्ट पैटर्न के बारे में जानकारी के लिए नीचे दिए गए बटन पर क्लिक करें.
Click the button below for information about the double top chart pattern.
One Comment